Generator Elution Calculator
Tips and Instructions:
- Time zone difference can be a negative/positive number or zero. Example: If the local time zone is Central Time and using a Lantheus TechneLite® generator (Eastern Time), time zone difference from ET would be "-1"
- Available generator sizes can be found here:
- GE Drytec™ *DISCONTINUED*
- Lantheus TechneLite®
- Curium Ultra-Technekow™ V4
- Enter times with : separator
- Recommended efficiency is 90-97%. Default is 93.5%.
- "Last Elution Date" and "Last Elution Time" must be entered for each calculation. It is assumed that each generator is eluted at the manufacturing facility prior to shipping. This should be taken into account when calculating the amount of Tc-99m in-growth prior to first use. Suggested times for factory test elutions:
- GE Drytec™ ≈ 07:00 GMT on shipping date
- Lantheus TechneLite® Weekday-Calibrated Generator ≈ 12:00 noon ET on calibration date
- Lantheus TechneLite® Sunday-Calibrated Generator ≈ 00:00 ET (or earlier) on calibration date
- Curium Ultra-Technekow™ V4 ≈ 03:00 - 06:00 CT on calibration date
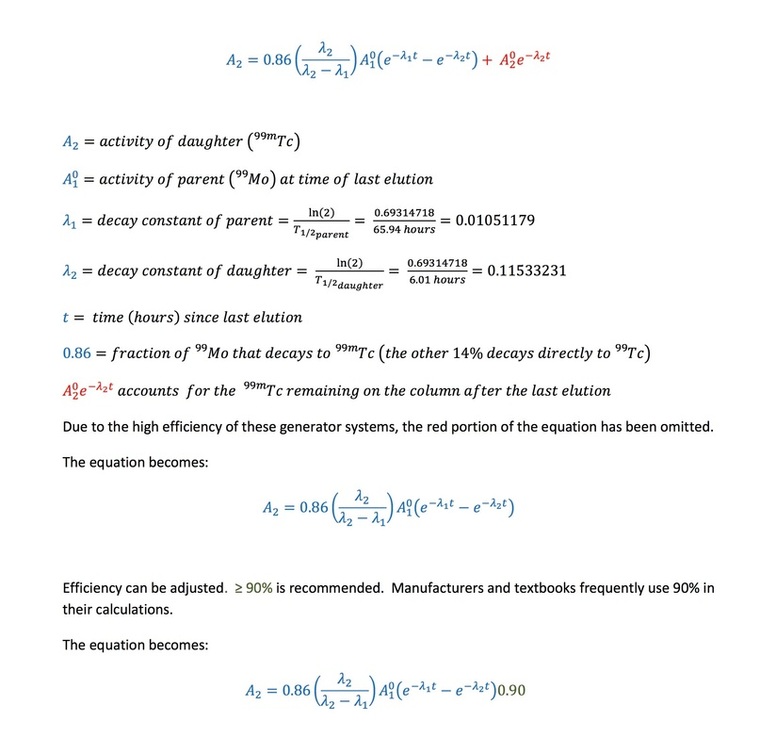
- The following calculations were used:
Relationship Between Tc-99m and Mo-99 in the Generator at Various Times after Elution
| Time (hr) | Curies Mo-99 | X | Ratio Tc-99m:Mo-99 | = | Curies Tc-99m |
|---|---|---|---|---|---|
| 0 | 1.000 | --- | --- | ||
| 0.5 | 0.995 | 0.048 | 0.048 | ||
| 1 | 0.990 | 0.094 | 0.093 | ||
| 1.5 | 0.984 | 0.138 | 0.136 | ||
| 2 | 0.979 | 0.179 | 0.175 | ||
| 2.5 | 0.974 | 0.218 | 0.212 | ||
| 3 | 0.969 | 0.255 | 0.247 | ||
| 3.5 | 0.964 | 0.290 | 0.280 | ||
| 4 | 0.959 | 0.324 | 0.311 | ||
| 4.5 | 0.954 | 0.356 | 0.340 | ||
| 5 | 0.949 | 0.386 | 0.366 | ||
| 5.5 | 0.944 | 0.414 | 0.391 | ||
| 6 | 0.939 | 0.441 | 0.414 | ||
| 6.5 | 0.934 | 0.467 | 0.436 | ||
| 7 | 0.929 | 0.492 | 0.457 | ||
| 7.5 | 0.924 | 0.515 | 0.476 | ||
| 8 | 0.919 | 0.537 | 0.494 | ||
| 8.5 | 0.915 | 0.558 | 0.511 | ||
| 9 | 0.910 | 0.578 | 0.526 | ||
| 9.5 | 0.905 | 0.596 | 0.539 | ||
| 10 | 0.900 | 0.614 | 0.553 | ||
| 10.5 | 0.895 | 0.631 | 0.565 | ||
| 11 | 0.891 | 0.647 | 0.576 | ||
| 11.5 | 0.886 | 0.662 | 0.587 | ||
| 12 | 0.881 | 0.677 | 0.596 | ||
| 13 | 0.872 | 0.704 | 0.614 | ||
| 14 | 0.863 | 0.728 | 0.628 | ||
| 15 | 0.854 | 0.750 | 0.641 | ||
| 16 | 0.845 | 0.769 | 0.650 | ||
| 17 | 0.836 | 0.787 | 0.658 | ||
| 18 | 0.827 | 0.803 | 0.664 | ||
| 19 | 0.819 | 0.817 | 0.669 | ||
| 20 | 0.810 | 0.830 | 0.672 | ||
| 21 | 0.802 | 0.841 | 0.674 | ||
| 22 | 0.794 | 0.852 | 0.676 | ||
| *23* | 0.785 | 0.861 | *0.676* | ||
| 24 | 0.777 | 0.870 | 0.676 | ||
| 25 | 0.769 | 0.877 | 0.674 | ||
| 26 | 0.761 | 0.884 | 0.673 | ||
| 27 | 0.752 | 0.890 | 0.669 | ||
| 28 | 0.745 | 0.896 | 0.668 | ||
| 29 | 0.737 | 0.901 | 0.664 | ||
| 30 | 0.729 | 0.905 | 0.660 | ||
| 32 | 0.714 | 0.913 | 0.652 | ||
| 34 | 0.699 | 0.919 | 0.642 | ||
| 36 | 0.685 | 0.924 | 0.633 | ||
| 38 | 0.671 | 0.929 | 0.623 | ||
| 40 | 0.657 | 0.932 | 0.612 | ||
| 44 | 0.630 | 0.937 | 0.590 | ||
| 48 | 0.604 | 0.940 | 0.568 | ||
| 54 | 0.567 | 0.943 | 0.535 | ||
| 60 | 0.532 | 0.944 | 0.502 | ||
| 66 | 0.500 | 0.945 | 0.473 | ||
| 72 | 0.469 | 0.946 | 0.444 | ||
| 78 | 0.440 | 0.946 | 0.416 | ||
| 84 | 0.414 | 0.946 | 0.392 | ||
| 90 | 0.388 | 0.946 | 0.367 | ||
| 96 | 0.365 | 0.946 | 0.345 |
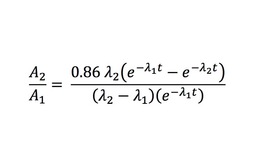
The ratio of Tc-99m to Mo-99 used in the above table was calculated using the equation:
Yield Charts Available from Manufacturers:
| drytec_yield_chart.xls | |
| File Size: | 59 kb |
| File Type: | xls |
| technelite_tc99m_yield_chart_mon_thru_fri.pdf | |
| File Size: | 257 kb |
| File Type: | |
| technelite_tc99m_yield_chart_-_sunday.pdf | |
| File Size: | 256 kb |
| File Type: | |
Mo-99 Breakthrough:
Limit = 0.15 µCi Mo-99 per 1 mCi Tc-99m at time of administration.
Calculations and a chart of Tc-99m expiration times based on Mo-99 breakthrough can be found here.
Limit = 0.15 µCi Mo-99 per 1 mCi Tc-99m at time of administration.
Calculations and a chart of Tc-99m expiration times based on Mo-99 breakthrough can be found here.


